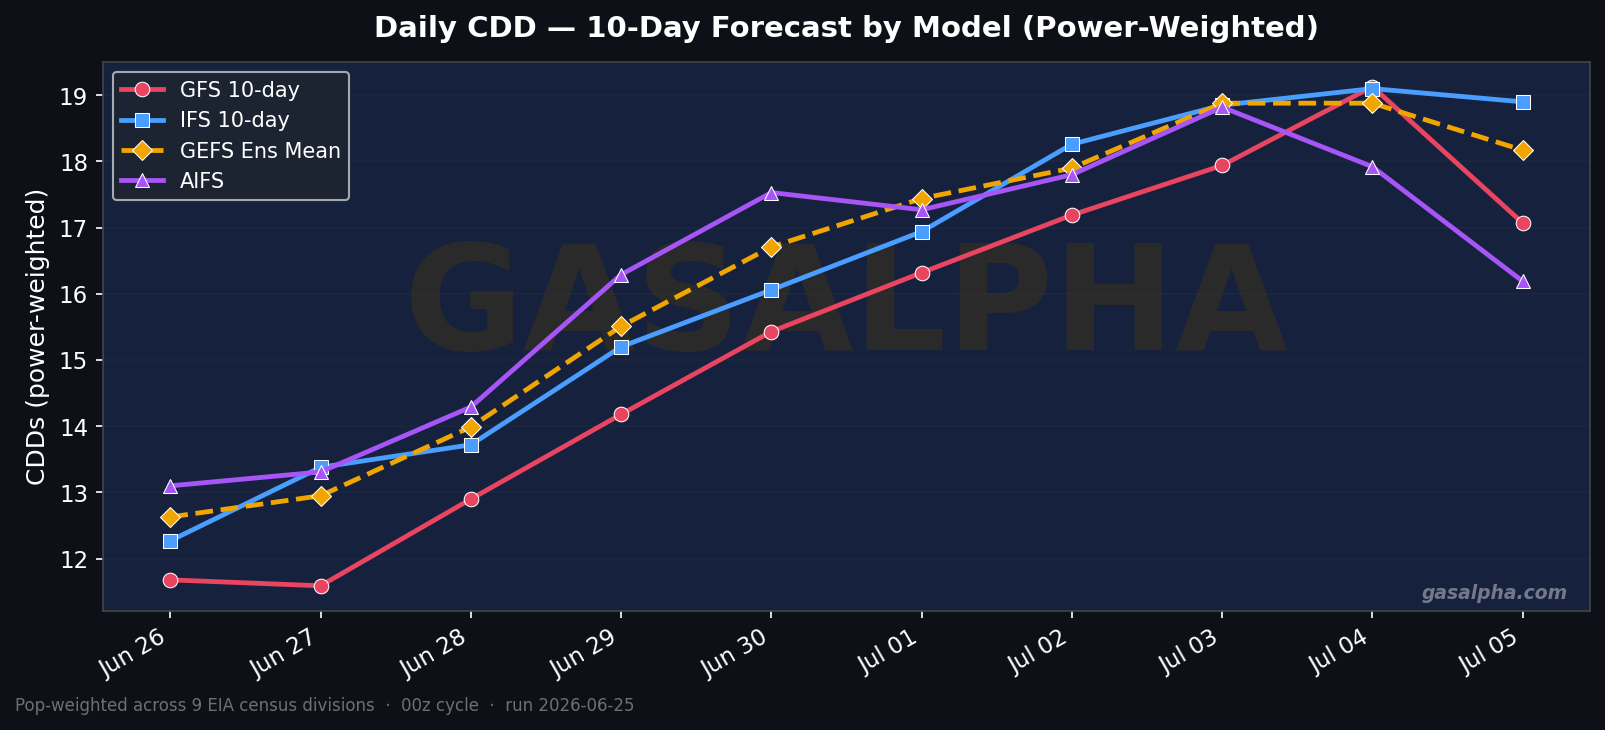
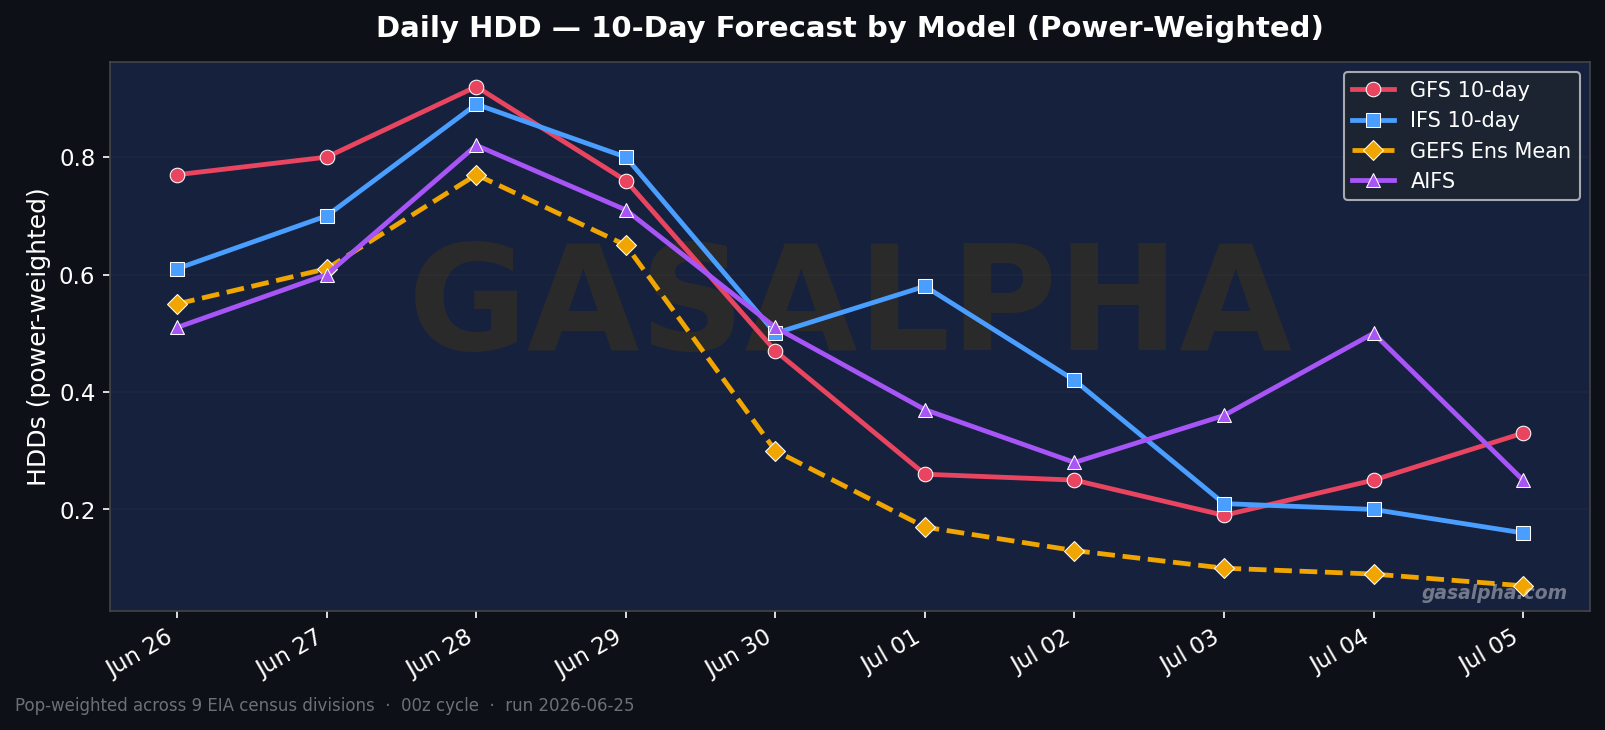
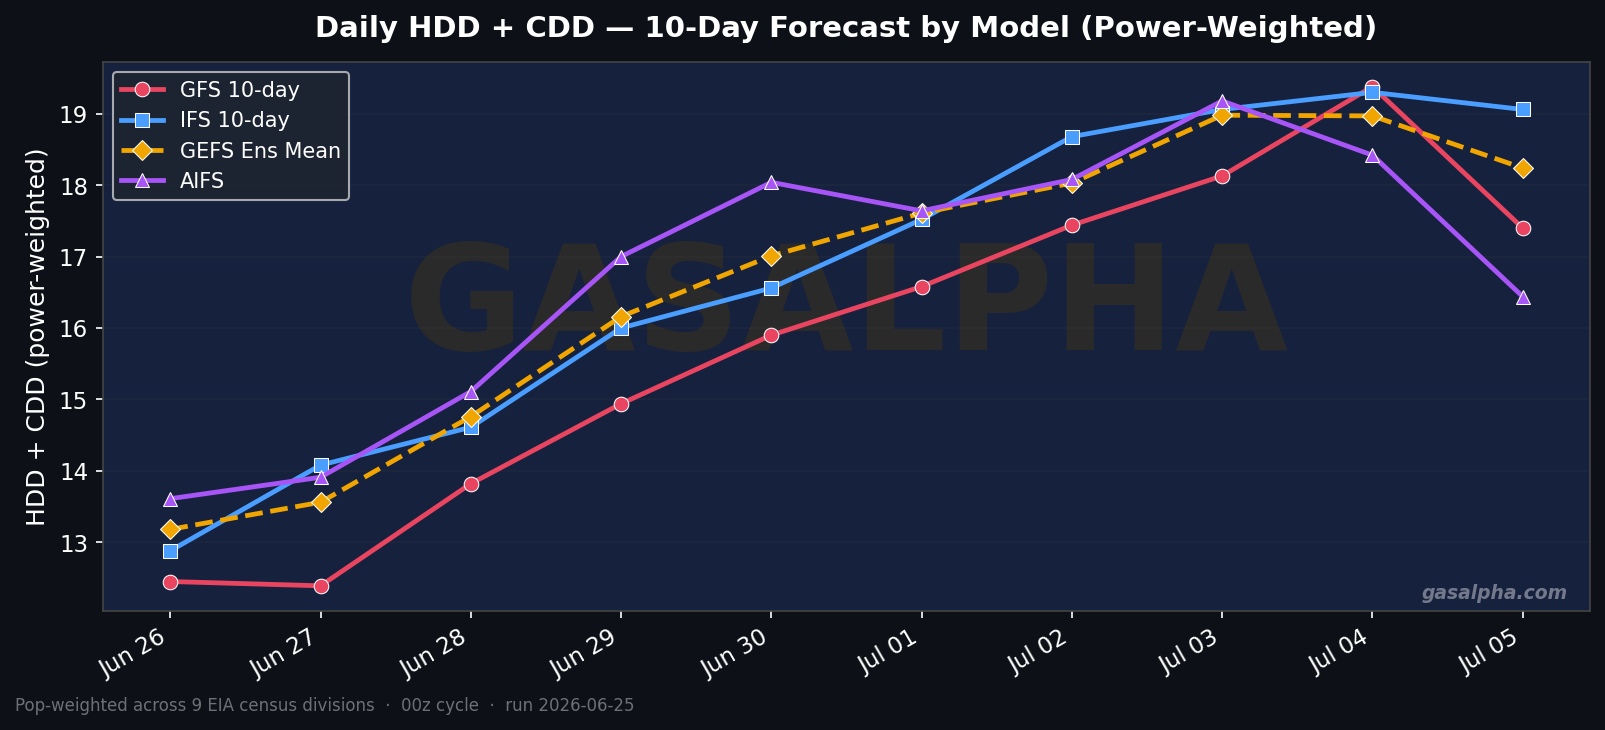
| Date | GFS | IFS | GEFS | AIFS |
|---|---|---|---|---|
| Jun 26 | 0.8 / 11.7 | 0.6 / 12.3 | 0.6 / 12.6 | 0.5 / 13.1 |
| Jun 27 | 0.8 / 11.6 | 0.7 / 13.4 | 0.6 / 12.9 | 0.6 / 13.3 |
| Jun 28 | 0.9 / 12.9 | 0.9 / 13.7 | 0.8 / 14.0 | 0.8 / 14.3 |
| Jun 29 | 0.8 / 14.2 | 0.8 / 15.2 | 0.7 / 15.5 | 0.7 / 16.3 |
| Jun 30 | 0.5 / 15.4 | 0.5 / 16.1 | 0.3 / 16.7 | 0.5 / 17.5 |
| Jul 01 | 0.3 / 16.3 | 0.6 / 16.9 | 0.2 / 17.4 | 0.4 / 17.3 |
| Jul 02 | 0.2 / 17.2 | 0.4 / 18.3 | 0.1 / 17.9 | 0.3 / 17.8 |
| Jul 03 | 0.2 / 17.9 | 0.2 / 18.9 | 0.1 / 18.9 | 0.4 / 18.8 |
| Jul 04 | 0.2 / 19.1 | 0.2 / 19.1 | 0.1 / 18.9 | 0.5 / 17.9 |
| Jul 05 | 0.3 / 17.1 | 0.2 / 18.9 | 0.1 / 18.2 | 0.2 / 16.2 |
| Division | Weight | Power Burn | States |
|---|---|---|---|
| South Atlantic | 24.0% | 24.0% | DE, DC, FL, GA, MD, NC, SC, VA, WV |
| West South Central | 17.7% | 17.7% | AR, LA, OK, TX |
| Middle Atlantic | 13.5% | 13.5% | NJ, NY, PA |
| East North Central | 11.1% | 11.1% | IL, IN, MI, OH, WI |
| East South Central | 8.9% | 8.9% | AL, KY, MS, TN |
| West North Central | 7.7% | 7.7% | IA, KS, MN, MO, NE, ND, SD |
| Pacific (CONUS) | 7.3% | 7.4% | CA, OR, WA |
| Mountain | 6.3% | 6.3% | AZ, CO, ID, MT, NV, NM, UT, WY |
| New England | 3.5% | 3.5% | CT, ME, MA, NH, RI, VT |
Power-weighted degree days (PWCDD) aggregate temperature data by where natural gas is actually burned to make electricity. They directly proxy power-burn demand — the dominant marginal driver of summer gas demand. While GWDD weights heating-heavy regions (Midwest, Mid-Atlantic) and POPDD weights where people live, PWCDD weights where gas-fired generation runs.
The result: South Atlantic (24.0%) and West South Central (17.7%) dominate the index — FPL, SOCO, Duke, and ERCOT carry the summer power burn. East North Central drops from 20% (GWDD) to 11%, reflecting the Midwest's smaller gas-fired generation share. This re-weighting is the entire point: PWCDD captures cooling-driven Bcf/d more accurately than either GWDD (heating bias) or POPDD (population bias).
All four models — GFS, IFS, GEFS, AIFS — run on the same cycle so HDD and CDD splits are apples-to-apples across models. Weights derived from 3 years of summer natural gas generation across 47 balancing authorities, mapped to the 9 EIA census divisions. CONUS only.