| Date | GFS | IFS | GEFS | AIFS |
|---|---|---|---|---|
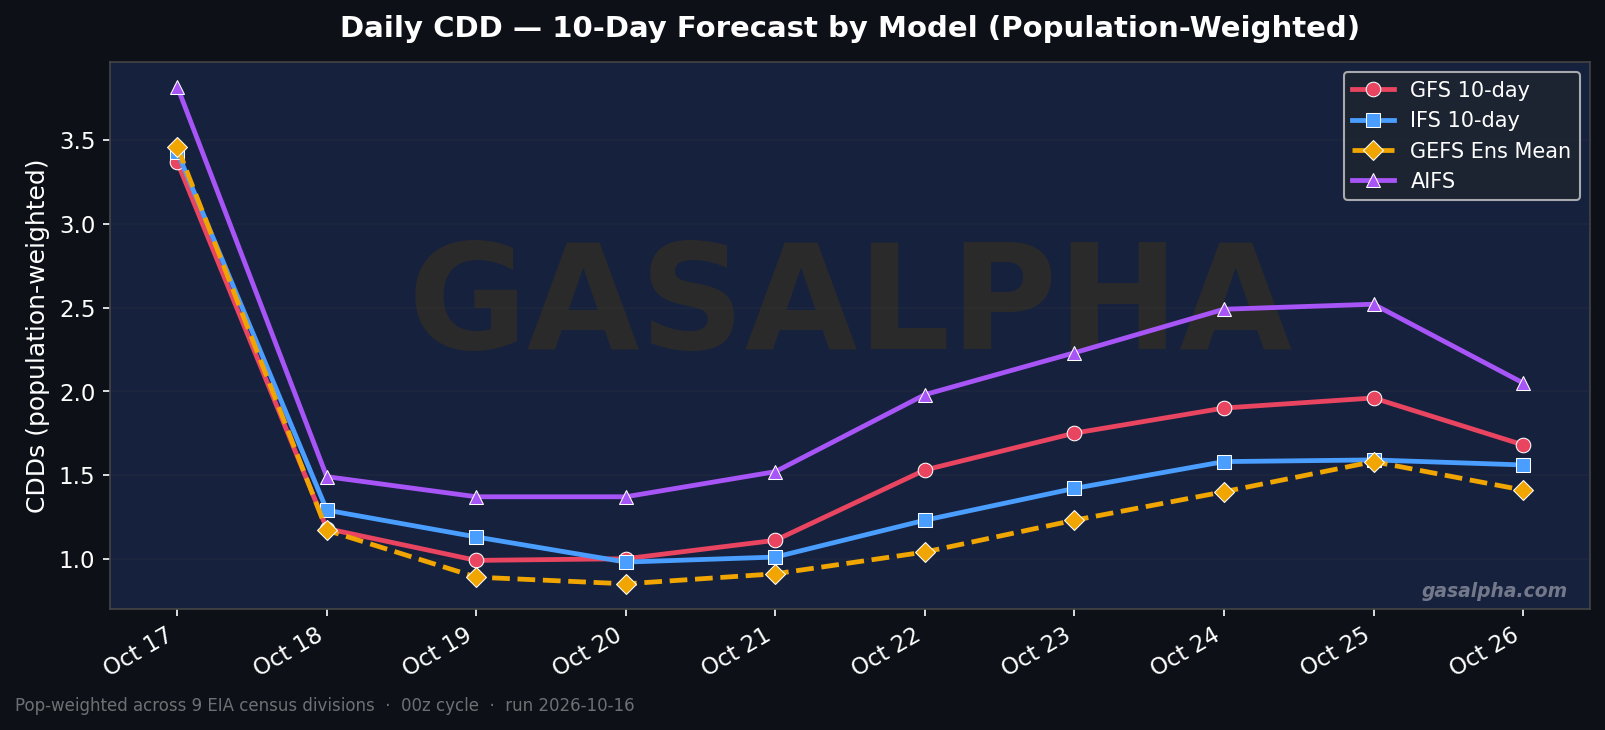
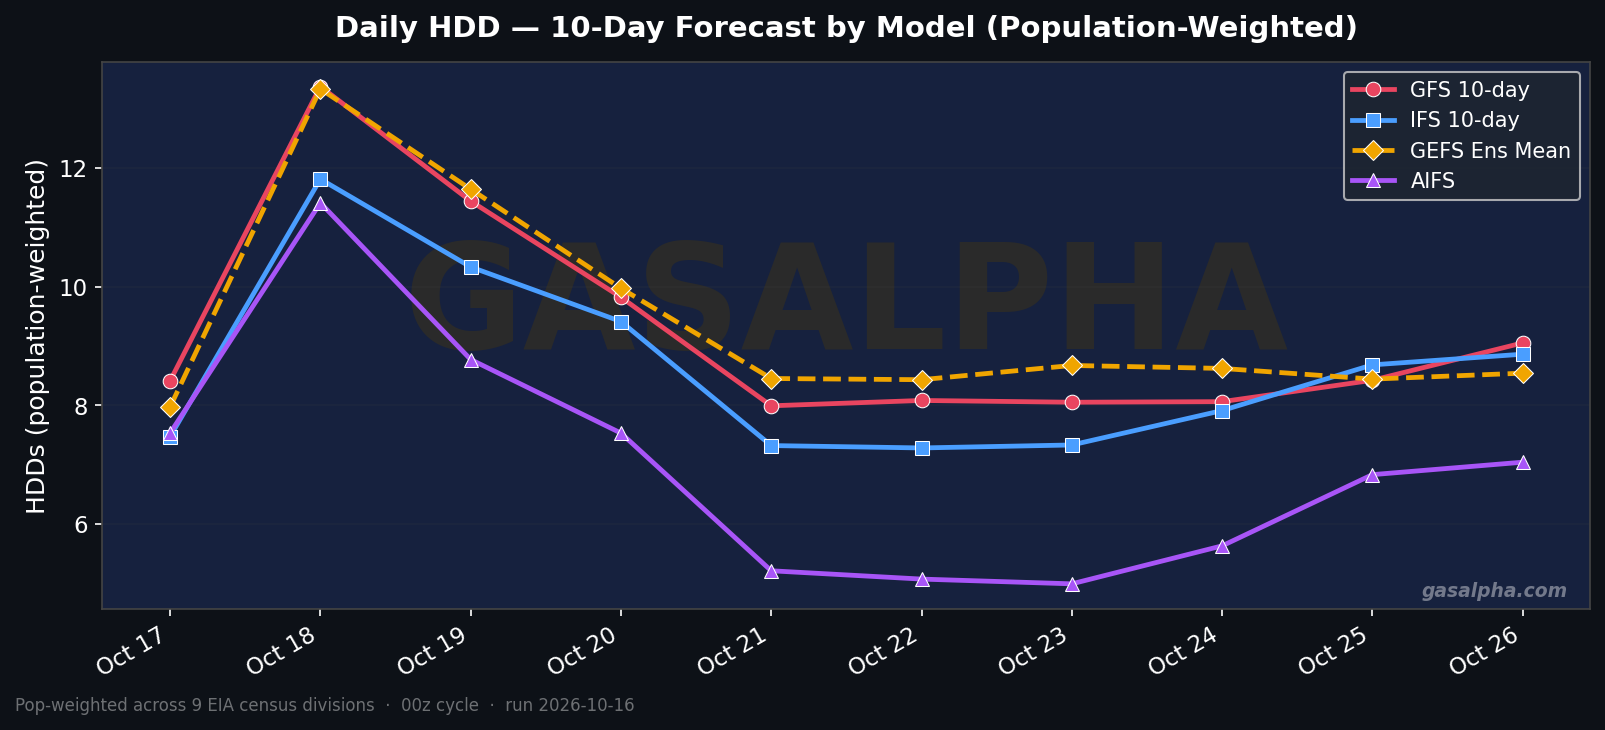
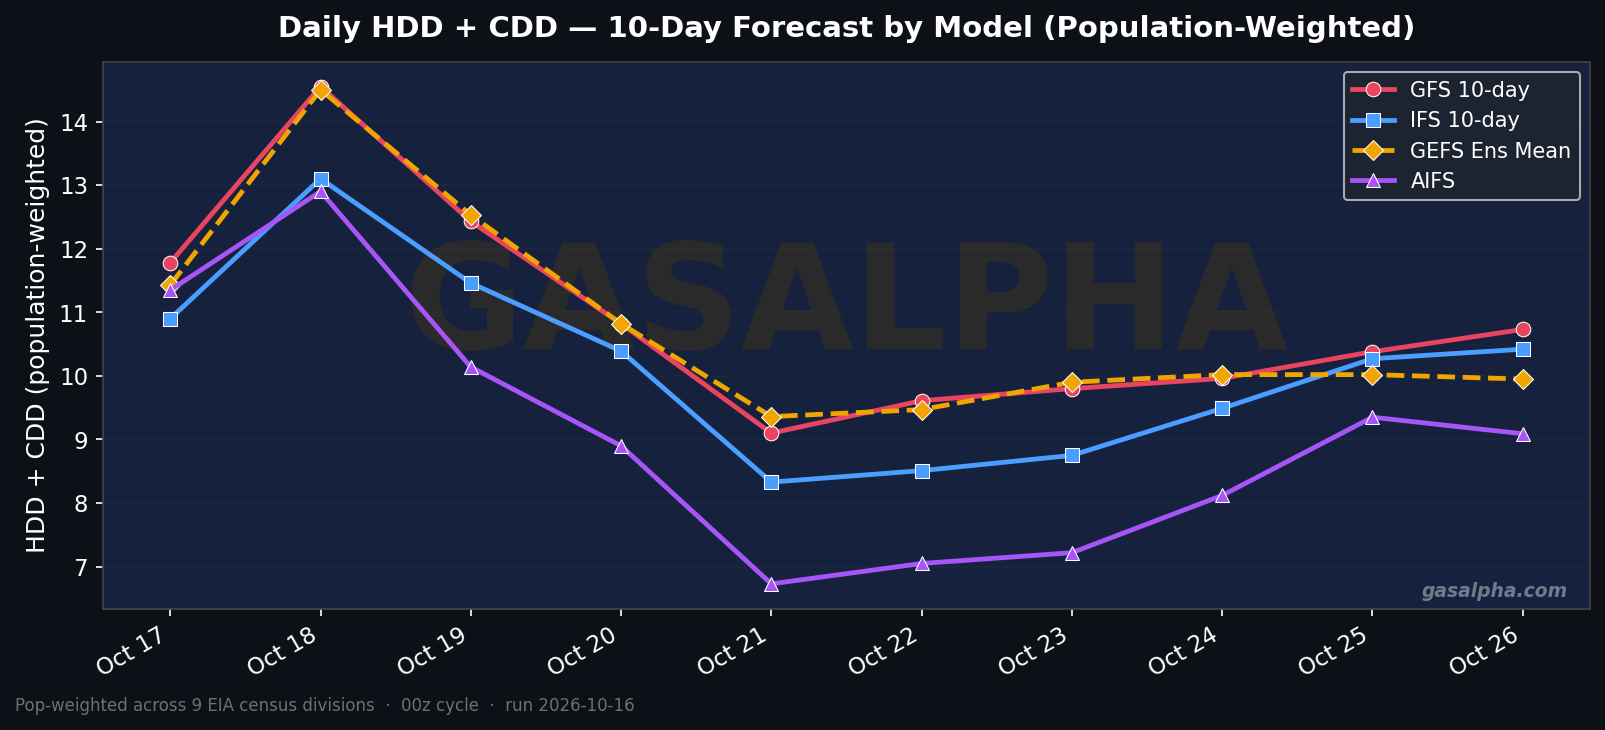
| Oct 17 | 8.4 / 3.4 | 7.5 / 3.4 | 8.0 / 3.5 | 7.5 / 3.8 |
| Oct 18 | 13.4 / 1.2 | 11.8 / 1.3 | 13.3 / 1.2 | 11.4 / 1.5 |
| Oct 19 | 11.4 / 1.0 | 10.3 / 1.1 | 11.6 / 0.9 | 8.8 / 1.4 |
| Oct 20 | 9.8 / 1.0 | 9.4 / 1.0 | 10.0 / 0.8 | 7.5 / 1.4 |
| Oct 21 | 8.0 / 1.1 | 7.3 / 1.0 | 8.4 / 0.9 | 5.2 / 1.5 |
| Oct 22 | 8.1 / 1.5 | 7.3 / 1.2 | 8.4 / 1.0 | 5.1 / 2.0 |
| Oct 23 | 8.1 / 1.8 | 7.3 / 1.4 | 8.7 / 1.2 | 5.0 / 2.2 |
| Oct 24 | 8.1 / 1.9 | 7.9 / 1.6 | 8.6 / 1.4 | 5.6 / 2.5 |
| Oct 25 | 8.4 / 2.0 | 8.7 / 1.6 | 8.4 / 1.6 | 6.8 / 2.5 |
| Oct 26 | 9.1 / 1.7 | 8.9 / 1.6 | 8.5 / 1.4 | 7.0 / 2.0 |
| Division | Weight | Population | States |
|---|---|---|---|
| South Atlantic | 20.3% | 67.5M | DE, DC, FL, GA, MD, NC, SC, VA, WV |
| Pacific (CONUS) | 15.8% | 52.5M | CA, OR, WA |
| East North Central | 14.1% | 46.8M | IL, IN, MI, OH, WI |
| Middle Atlantic | 12.5% | 41.5M | NJ, NY, PA |
| West South Central | 12.4% | 41.2M | AR, LA, OK, TX |
| Mountain | 7.8% | 26.0M | AZ, CO, ID, MT, NV, NM, UT, WY |
| West North Central | 6.4% | 21.3M | IA, KS, MN, MO, NE, ND, SD |
| East South Central | 5.8% | 19.2M | AL, KY, MS, TN |
| New England | 4.5% | 15.0M | CT, ME, MA, NH, RI, VT |
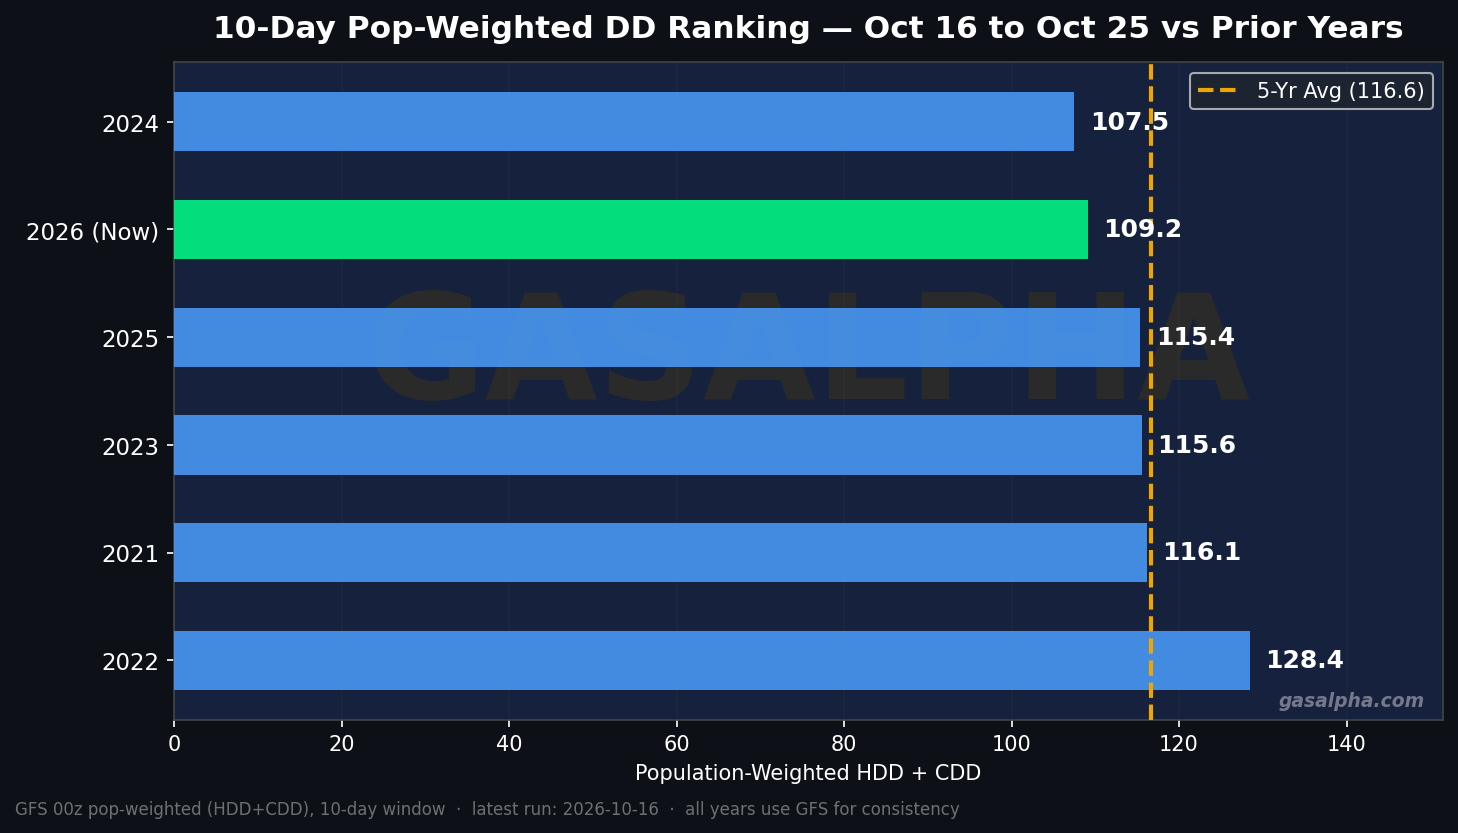
Population-weighted degree days aggregate temperature data by where people live rather than by where natural gas is consumed. They are the industry default for general weather analytics and best capture cooling-driven demand — summer power burn for AC tracks population centers more closely than gas-utility consumption.
For comparison, GasAlpha's headline GWDD (on the main dashboard) uses gas-utility-consumption weighting, which over-weights gas-heating-heavy regions like the Midwest and Mid-Atlantic. That is the better metric for winter heating demand and storage draws; population-weighted CDD is the better metric for summer cooling and power burn.
All four models — GFS, IFS, GEFS, AIFS — are run on the same cycle (the slowest model's availability window) so HDD and CDD splits are apples-to-apples across models. Population weights derived from 2023 ACS estimates, CONUS only (Alaska and Hawaii excluded by the lat/lon mask).